If you pulled up Mount Tabor's numbers this month, you'd see two facts that shouldn't both be true. The median sale price over the three months ending in May 2026 was $780,000, down 1.6 percent from the same stretch a year earlier. Meanwhile the median price per square foot climbed 4.8 percent over that same year, landing at $337. A neighborhood can't be getting cheaper and more expensive at the same time. Something else is going on, and it matters for anyone trying to figure out what a Mount Tabor budget actually buys right now.
The short version: the median didn't fall because Mount Tabor lost value. It fell because the mix of what's selling changed. And once you understand that shift, a second assumption buyers walk in with, that a view lot automatically costs more, starts to look shaky too.
The Math Behind the Contradiction
A median price tracks whatever happens to sell in a given window. It says nothing about the homes that didn't sell, and it blends houses, condos, townhomes, and multifamily units into one number. Mount Tabor's recent activity has been quietly diversifying beyond the single-family stock that used to dominate its sales data. In a recent one-month stretch this summer, the neighborhood's closed transactions included not just houses but three condos, a townhome, and two multifamily units. A separate look at active view-tagged inventory around the same time showed a condo, a townhome, and four multifamily properties in that pool as well, including a newly constructed 16-unit apartment building in North Tabor marketed as an investment property rather than a personal residence.
When smaller units and multifamily properties enter a sales sample that used to be almost entirely detached houses, the median price gets pulled down even if every individual property type is holding or gaining value per square foot. That's exactly what the data shows: the blended median dropped, but the per-square-foot figure, which normalizes for size, went up. Buyers reading only the median headline would conclude Mount Tabor is softening. Buyers who look at price per square foot would conclude it's tightening. Both readings come from the same three months of sales. Neither is wrong. They're just answering different questions.
For a seller, the takeaway is specific. If your home is a standard single-family house similar to what's historically sold here, the median price drop is not your comp. Your relevant number is the $337 per square foot figure, and it moved the right direction.
Why "View Lot" Isn't One Category
Buyers hunting a view often treat it as a fixed line item, worth a predictable premium over a comparable house without one. Mount Tabor's current inventory doesn't support that. As of this August, the twelve active listings tagged with a view carried a median list price of $695,000, which sits below the neighborhood's three-month median sale price of $780,000. That's backward from what a view premium should look like.
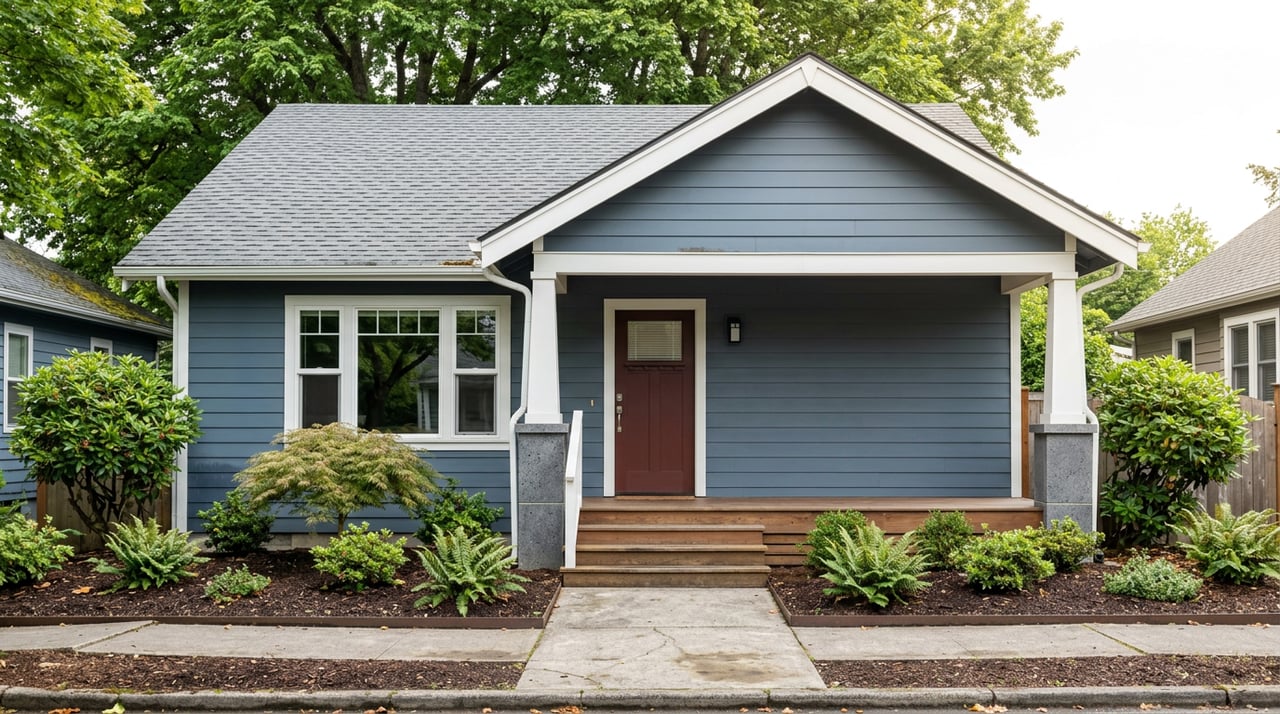
The explanation is in the properties themselves, not in some market inefficiency. A 1928 cottage on SE Gilham that came to market this year after roughly seventy years with the same owners offers about 1,300 square feet, a 4,600 square foot lot, and a view described as trees and horizon from an upstairs perch reached by a set of stairs. It's charming and it's been updated in places, but it's still a compact, century-old house competing on lot and location rather than size or systems. Compare that to a different Mount Tabor listing, a mid-century home with more than 2,000 square feet on the main level plus a daylight lower level with a two-bedroom accessory dwelling unit, marketed with sweeping downtown and city views. These are not the same product. They both get labeled "view," but one is an entry-level cottage and the other is a move-up property with income potential built in.
The current crop of view-tagged listings leans toward the first category more than the second, which is dragging the group's median list price below the neighborhood average. That's a temporary condition of what happens to be for sale right now, not a permanent discount on elevation. It also means a buyer chasing a view shouldn't assume they'll overpay. They should ask what they're actually getting for it: a partial tree line from a small footprint, or a genuine skyline view attached to real square footage.
Two Sides of the Same Hill
Mount Tabor runs from SE 49th to SE 76th and from Burnside down to Division, with the park itself, a 190-acre volcanic cinder cone topping out around 600 feet, sitting at the center. That geography splits the neighborhood into two lived experiences that show up in the housing stock.
The flatter blocks toward the western and southern edges sit closer to Hawthorne and Division, where the neighborhood's small commercial cluster lives. The Albina Press coffee shop, The Sapphire Hotel, and Por Que No?! give that stretch its character, and the Portland Nursery, over a hundred years old, sits inside the neighborhood as well. Houses here tend to be denser, closer to foot traffic, and more likely to be foursquares, bungalows, or postwar builds on smaller lots.
The streets that climb toward the park's reservoirs and summit are quieter and further from that commercial edge. This is where the view inventory concentrates, along with the dog park and community garden near the top. Homes up here trade proximity to Hawthorne's restaurants for elevation, tree cover, and a slower block.
Neither side is objectively better. They're different products with different tradeoffs, and the price-per-square-foot data suggests both are holding value even while the blended median moves around based on what's transacting in a given quarter.
The Days-on-Market Number Depends on Who's Counting
Here's a detail that trips up buyers trying to gauge urgency. Two trackers looking at Mount Tabor within months of each other reported wildly different figures. One, checked this August, showed homes averaging around six days on market with multiple offers common and sale prices running 5 to 11 percent above list. Another, using May 2026 data specifically, put the median days on market at 24, describing that as unchanged from the year before.
These aren't contradictory measurements of two different markets. They're two different definitions of the same market, and mixing them up leads to bad assumptions about how fast you need to move.
The gap comes down to methodology. An average pulled from the hottest, fastest-selling homes in a small dataset will always look more competitive than a median that includes everything on the market, including listings that lingered. If you're a buyer being told a neighborhood moves in six days, and then you watch a house sit for three weeks, you're not seeing a slowdown. You're seeing the difference between an average of a hot subset and a median of the full pool.
The practical read for Mount Tabor right now: well-priced, move-in-ready homes in good condition are still moving fast and drawing multiple offers, consistent with the six-day, over-list figures. Properties needing work, priced ambitiously, or sitting in a less differentiated part of the market take longer, closer to that 24-day median. Both are true simultaneously, which is normal in a market this size with only a few dozen sales a month.
What This Means If You're Comparing Neighborhoods
If Mount Tabor is on your shortlist against nearby SE Portland neighborhoods, the number to anchor on is price per square foot, not the median sale price, since the median here is currently more sensitive to product mix than value. If a view is part of the appeal, look at what specific square footage and condition that view is attached to before assuming it costs extra. And if you're being quoted a days-on-market figure by any source, ask whether it's an average of recent hot sales or a median across everything, because in a neighborhood this size the two numbers tell different stories.
Frequently Asked Questions
Is Mount Tabor's housing market cooling down? Not based on price per square foot, which rose 4.8 percent year over year through the three months ending in May 2026. The median sale price fell over the same period, but that reflects more condos and multifamily units entering the sales mix, not a broad decline in value.
Do homes with mountain or city views cost more in Mount Tabor? Not reliably, at least not in the current inventory. View-tagged listings recently carried a median list price below the neighborhood's overall median, largely because several of them are smaller, older cottages rather than larger updated homes.
How fast do homes actually sell in Mount Tabor? It depends which homes. Move-in-ready properties in good condition have been going pending in about six days with multiple offers. Homes needing more work or priced aggressively have taken closer to three weeks based on the broader median.
If you're weighing Mount Tabor against another SE Portland neighborhood, or trying to figure out what a specific budget actually buys on the hill versus down near Hawthorne, a conversation with someone who tracks this data block by block is worth more than another portal search. Devin Arthurs offers a free market consultation to walk through exactly this kind of comparison, house by house and number by number.